
Excess and umbrella casualty is one of the hardest lines to intake well. A single submission for a mid-market trucking or manufacturing account can run to a dozen files: the broker’s email with the ask, an ACORD 125, a schedule of underlying policies, a five-year exposure workbook, a per-vehicle fleet schedule, a statement of values, five years of loss runs from three carriers, and a set of financials. The information that actually decides the price — the trend in revenue and fleet size, the development on open claims, the attachment adequacy of the underlying tower — is buried across those files, in different formats, and it is almost never on any one page.
Most intake tools read one document at a time and hand back a flat list of fields. That is not how an excess account is underwritten. InsightXtract runs an agentic, multi-document pipeline that classifies each file, extracts to a per-document schema, consolidates everything into one unified account record, links it into an entity graph, and validates it against your rules — so the underwriter opens a single, coded, cited record instead of a stack of PDFs.
ACORD · underlying
exposure · vehicles
SOV · loss runs · fin] --> B[Classify
each document] B --> C[Extract to the
right schema] C --> D[Consolidate
by source priority] D --> E[Link into an
entity graph] E --> F[Validate
rules + reference data] F --> G[One coded,
cited account record]
One submission, many documents, one connected record — classify, extract, consolidate, link, validate.
The idea that governs everything: the time series is the price
Before the categories, the single most important concept. In excess casualty, a snapshot is nearly useless — the trend is the risk. An account doing $88M in revenue tells you little; an account that grew from $46M to $88M in three years while its fleet went from 70 to 120 power units is a very different exposure, and its excess rate should reflect that. The same is true of losses: a $312K total incurred means one thing if it’s flat and another if it’s developing upward with open reserves.
So InsightXtract captures the exposure and loss data not as single values but as time series — the current term plus three to five prior years. In the tables below, the Captured column flags this explicitly:
- Current — captured once for this term.
- Current + prior — captured per year so the model sees the trend.
- Per-row — a table: one vehicle, location, underlying policy, or claim per row.
- Point-in-time — a single static fact.
A & B · Insured, account, and broker
Who the account is and who’s placing it — identity, legal structure, operations classification, and the distribution chain. Sources: ACORD, broker email.
| Parameter | Captured | Why it matters |
|---|---|---|
| Named insured, DBAs, FEIN, entity type | Point-in-time | The contract party and unique account key — drives clearance, conflicts, and de-dupe. |
| NAICS · SIC · ISO GL class · operations description | Point-in-time | Class-based rating and appetite/knockout — the hazard grade beyond the code. |
| Years in business · parent / subsidiaries | Point-in-time | Stability credit and aggregation of exposure across a group. |
| Broker / agency · contact · wholesaler chain | Point-in-time | Distribution routing, binding authority, and correspondence. |
C & D · Submission and requested coverage
The ask itself — term, transaction, and the exact shape of the excess/umbrella cover being requested. Sources: broker email, ACORD.
| Parameter | Captured | Why it matters |
|---|---|---|
| Product · transaction (new/renewal) · effective & expiration | Current | Coverage form, workflow, term, and binding deadline. |
| Target / expiring premium | Current + prior | Price-to-beat and the rate-change baseline for a renewal. |
| Each-occurrence & aggregate limit | Current | The capacity being offered — the core of the ask. |
| Attachment point / SIR · layer position | Current | Buffer vs. high-excess — drives burn-through risk and price. |
| Follow-form vs. standalone · drop-down · sublimits · defense inside/outside | Per-row | Scope alignment with the underlying and true limit erosion. |
| Occurrence vs. claims-made · retro date · territory | Current | Trigger, tail exposure, and geographic terms. |
E · The underlying tower — one row per policy
An umbrella is only as sound as what it sits over. InsightXtract reads the schedule of underlying policies as a table — one row each. Source: underlying-policy schedule, ACORD.
| Parameter | Captured | Why it matters |
|---|---|---|
| Line (GL / Auto / Employers Liab / Foreign) · carrier · AM Best · admitted? | Per-row | What the umbrella follows and the security of the paper below it. |
| Policy number · effective / expiration | Per-row | Concurrency with the excess term — gaps are a knockout. |
| Underlying limits (per-occ / agg / CSL) · retention / deductible | Per-row | Attachment adequacy — is the umbrella actually sitting where the ask says? |
| Underlying premium · aggregate erosion | Per-row | Rate adequacy below, and impaired aggregates that pull the excess down. |
F · Financial exposure — the exposure base, year by year
This is where the trend lives. Each metric is captured for the current term and three-to-five prior years, because the year-over-year change drives the excess rate far more than any single value. Sources: exposure workbook, financials, ACORD.
| Parameter | Captured | Why it matters |
|---|---|---|
| Annual revenue / sales / gross receipts | Current + 5 yr | Primary exposure base — growth means rising exposure the rate must track. |
| Total payroll · employee count (FT/PT/seasonal) | Current + 5 yr | Injury and employers-liability exposure base and workforce-mix trend. |
| Subcontractor / 1099 spend | Current + prior | Contingent and transferred liability the umbrella may absorb. |
| Units produced / sold · square footage · admissions | Current + prior | The class-appropriate exposure unit for rating. |
| Foreign / international sales % | Current + prior | Foreign-liability and venue exposure that changes the tower. |
| Projected next-term exposure | Current | The forward-looking basis the layer is actually rated on. |
G · Auto & fleet exposure — fleet summary + per-vehicle schedule
Auto is the most common driver of umbrella losses and the source of nuclear verdicts. InsightXtract captures the fleet summary (with prior-year counts for trend) and a row per vehicle from the vehicle schedule / ACORD 129. Sources: vehicle schedule, exposure workbook, ACORD.
| Parameter | Captured | Why it matters |
|---|---|---|
| Total power units & trailers | Current + prior | Fleet size and growth — a direct frequency-trend signal. |
| Units by type (PPT / light / medium / heavy / tractor) & GVW class | Per-row | Severity mix — heavy trucks drive the biggest verdicts. |
| Radius of operation · annual mileage (total & per unit) | Current + prior | True road exposure and interstate-venue risk; miles-based rating. |
| DOT # · MC # · hazmat / placarded · CSA scores | Point-in-time | FMCSA identity, hazard escalation, and a regulatory safety signal. |
| Driver count · MVR standards · avg experience | Current | Driver quality — the number-one auto loss driver. |
| Per vehicle: year · make · model · VIN · GVW · cost new/ACV · class · use · radius · garaging | Per-row | The covered-unit schedule — per-unit rating and physical-damage value. |
H, I & J · Premises, products, and geography
The rest of the exposure surface — where the operations physically sit, what they make and do, and which venues they touch. Sources: statement of values, ACORD, exposure workbook.
| Parameter | Captured | Why it matters |
|---|---|---|
| Per location (SOV): address · occupancy · sq ft · owned/leased · construction · TIV | Per-row | Premises-liability footprint and slip-and-fall exposure. |
| Products / completed-ops description & aggregate · recall history | Current | Products-liability and recall severity the umbrella covers. |
| Subcontractor use · additional-insured status · contractual liability assumed | Current | Where liability actually lands — risk-transfer quality. |
| Per state: payroll · revenue · units · miles by jurisdiction | Per-row | Venue-weighted exposure and social-inflation / nuclear-verdict risk. |
K · Loss history — five-year loss runs, per-claim + rollups
The single biggest pricing input. InsightXtract reads each claim as a row across the five-year loss run — often from several carriers — and computes the rollups that matter. Source: loss runs.
| Parameter | Captured | Why it matters |
|---|---|---|
| Per claim: claim # · date of loss · line · state · cause · claimant · litigation | Per-row | Each loss’s identity, venue, nature, and escalation potential. |
| Per claim: incurred · paid · outstanding reserve · status (open/closed) | Per-row | Cost, development, and open exposure still on the books. |
| Total incurred & claim count by year · loss ratio · frequency · avg severity · largest loss | Current + 5 yr | Frequency and severity trend — rate adequacy and volatility. |
| Losses in the excess layer · open reserves · loss-run valuation date | Current | Burn-through relevance to the attachment and data freshness. |
L, M & N · Prior insurance, risk quality, and financials
The context that separates two accounts with identical exposures — continuity, safety culture, and solvency. Sources: ACORD, broker email, financials.
| Parameter | Captured | Why it matters |
|---|---|---|
| Expiring carrier · limits · retention · premium · prior excess carriers (5 yr) · continuity date | Current + prior | Rate-change baseline, coverage continuity, and claims-made tail. |
| Coverage gaps · declinations · cancellations / non-renewals | Prior 5 yr | Adverse-selection and moral-hazard flags. |
| Fleet safety / telematics · driver hiring standards · WC experience mod (EMR) | Current + prior | Safety culture — the proxy for future frequency. |
| Total assets · liabilities · net worth · revenue · EBITDA · D&B · bankruptcy history | Current + prior | Ability to fund the retention and collectibility of the SIR. |
From fourteen categories to one connected record
Pulling these parameters out of eight documents is only half the job. The value is in consolidation: the insured named on the ACORD, the broker on the email, the underlying limits on the schedule, the fleet on the vehicle workbook, and the claims on three loss runs all describe one account. InsightXtract merges them into a single record by a declared source-of-truth priority (the ACORD wins over the email on insured details; the underlying schedule wins on attachment), and links the result into an entity graph — insured at the centre, connected to broker, submission, coverage, underlying policies, fleet, locations, and loss history.
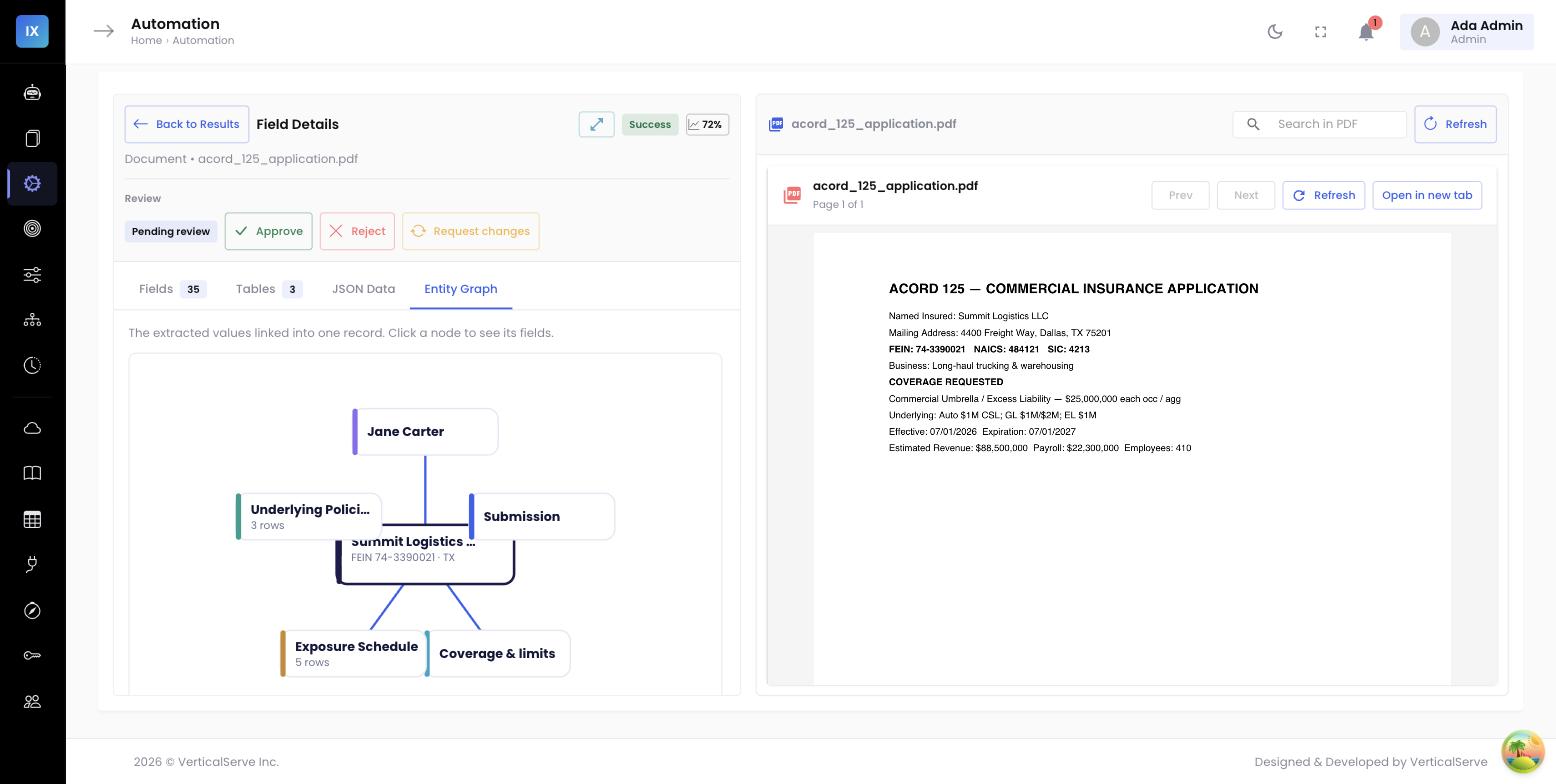
Why the graph, not just a form
An underwriter doesn’t think in flat fields — they think in relationships: does the underlying tower actually support the requested attachment? Does the fleet growth line up with the revenue growth and the loss trend? The entity graph makes those connections explicit and clickable, with every value cited back to the page it came from.
Why it matters to the business
Comprehensive, structured, trend-aware extraction isn’t a data-entry nicety — it changes the economics and quality of the book:
- Better-priced risk. Capturing exposures and losses as a five-year time series — not a snapshot — lets you rate to the trend, which is where excess money is won or lost.
- Fewer missed exposures. The parameters that cause surprises — an impaired underlying aggregate, a hazmat fleet, a developing open claim, a coverage gap — are exactly the ones buried deep in the schedules. Extracting them by default means they reach the underwriter instead of the claim file.
- Faster quotes, more capacity. An underwriter opening a consolidated, cited record instead of a dozen PDFs triages and prices in minutes, not hours — more submissions handled without more headcount.
- Consistency and auditability. The same categories, coded the same way, every time — with provenance to the source document. That is the difference between a repeatable book and one that depends on which underwriter opened the file.
- Portfolio intelligence. Once every submission is coded to the same schema, the exposure and loss trends roll up — you can see fleet growth, venue concentration, and loss development across the whole book, not one account at a time.
The Excess Casualty agent extracts all of this today — the account, submission, coverage, and underlying tower; the per-state/class exposure schedule; the fleet broken down by vehicle type; the multi-year exposure and auto-unit history; and the loss run — consolidated into one coded record of 50+ fields and six linked tables, every value cited to its source document. The point this post makes is why it matters: the trend and the per-vehicle detail are exactly what move an excess price, so they’re captured by default. And because it’s all configuration — fields and tables in the agent’s output contract, not code — the schema keeps pace with what underwriters ask for.
Related reading →
See the discipline behind trusting these numbers: how to evaluate a data-extraction product for P&C insurance, and how multi-document submissions get consolidated into one record.