
Fleet auto is a deceptively hard line to intake. On the surface it looks simple — count the trucks, apply a rate — but the risk lives in the detail: the mix of heavy tractors versus light vans, how far they run, who is behind the wheel, and what the last three years of losses actually did. A single mid-market trucking submission arrives as a broker email with the ask, a fleet application, an Excel vehicle schedule that can run to hundreds of rows, a driver roster, and a loss run from the expiring carrier. The information that decides the price is spread across all of them, and it is almost never on one page.
Most intake tools read one document at a time and hand back a flat list of fields. That is not how a fleet is underwritten. InsightXtract runs an agentic, multi-document pipeline that classifies each file, extracts to a per-document schema, consolidates everything into one unified account record by declared source priority, and validates it against reference data — so the underwriter opens a single, coded, cited record instead of a stack of files and spreadsheets.
fleet application
vehicle schedule
driver schedule
loss run] --> B[Classify
each document] B --> C[Extract to the
right schema] C --> D[Consolidate
by source priority] D --> E[Standardize +
reference lookups] E --> F[Validate
rules + coded data] F --> G[One coded,
cited fleet record]
One submission, five documents, one connected record — classify, extract, consolidate, standardize, validate.
The idea that governs everything: the fleet is a portfolio of units and drivers
Before the categories, the concept that shapes the whole schema. In commercial auto, a fleet is not one exposure — it is a portfolio of individual units and individual drivers, each with its own severity and frequency profile. A summary count of “42 power units” hides the fact that six of them are heavy tractors running a 500-mile radius while the rest are local vans. So InsightXtract captures both the fleet-level summary fields the application declares and the row-per-unit and row-per-driver schedules that reveal the real mix. In the tables below, the Captured column flags how each parameter is held:
- Point-in-time — a single static fact about the account.
- Current — captured once for this term.
- Per-row — a table: one vehicle, one driver, or one claim per row.
- Historical — the loss run, read as a claim-by-claim history.
A · Insured & identity
Who the account is — the legal entity, its classification, and the operating profile that anchors clearance and appetite. Source: fleet application (with the broker email as a fallback on the insured name).
| Parameter | Captured | Why it matters |
|---|---|---|
| Named insured · DBA · FEIN · entity type | Point-in-time | The contract party and unique account key — drives clearance, conflicts, and de-dupe. |
| Mailing / physical address · risk state | Point-in-time | Garaging jurisdiction and venue — the risk state is standardized against the state-code lookup. |
| NAICS code · SIC code · business description | Point-in-time | Class-based rating, appetite, and knockout — NAICS is coded against the reference table. |
| Years in business | Point-in-time | Operating stability — a new venture and a 30-year carrier are different frequency risks. |
| Estimated revenue · total payroll · employee count | Current | The exposure base behind the fleet — revenue and payroll are normalized to currency. |
B · Broker & submission
The ask itself — who is placing it, for what product, and on what timeline. Source: broker submission email.
| Parameter | Captured | Why it matters |
|---|---|---|
| Broker name · broker email | Point-in-time | Distribution routing, correspondence, and the relationship the submission arrives through. |
| Product | Current | Confirms the line being requested — commercial auto / fleet — and the right workflow. |
| Effective date | Current | Term start and binding deadline — normalized to an ISO date for the workflow clock. |
| Requested limit | Current | The capacity the broker is asking for — the headline of the ask. |
C · Coverage & limits
The exact shape of the auto cover being requested — the liability limit, the ancillary coverages that quietly drive severity, and the target premium. Source: fleet application.
| Parameter | Captured | Why it matters |
|---|---|---|
| Auto liability CSL | Current | The core capacity on the primary auto layer — normalized to currency. |
| Combined single limit | Current | The single figure covering bodily injury and property damage together — the number verdicts test. |
| Hired & non-owned coverage | Current | Whether borrowed and employee vehicles are covered — a common gap that becomes a surprise claim. |
| Cargo limit | Current | Motor-truck cargo exposure — ties the coverage to what the fleet actually hauls. |
| Physical damage coverage | Current | Whether the units themselves are insured — drives the physical-damage rating and stated values. |
| Target / quoted premium | Current | The price-to-beat and the rate-adequacy baseline — normalized to currency. |
D · Fleet summary & exposure
The account-level size and shape of the fleet — how many units, how far they run, and whether they carry anything that escalates the hazard. Source: fleet application.
| Parameter | Captured | Why it matters |
|---|---|---|
| Power units · total power units | Current | Fleet size — the primary exposure count that scales premium. |
| Total trailers | Current | Towed-unit exposure beyond the powered fleet — added liability surface. |
| Driver count | Current | Drivers-to-units ratio — a signal of shift work, utilization, and hiring pressure. |
| Radius of operation | Current | Local vs. long-haul — the single biggest determinant of interstate-venue and fatigue risk. |
| Annual mileage | Current | True road exposure for miles-based rating — normalized to a numeric value. |
| Hazardous materials | Current | Placarded / hazmat operations — a hard hazard escalation and appetite trigger. |
E · DOT / MC / CSA regulatory identity
The FMCSA footprint — the identifiers that tie the account to federal safety data and let an underwriter pull the carrier’s public record. Source: fleet application.
| Parameter | Captured | Why it matters |
|---|---|---|
| DOT number | Point-in-time | The USDOT identity — the key to the carrier’s federal safety and inspection history. |
| MC number | Point-in-time | Motor-carrier operating authority — confirms interstate for-hire status. |
| CSA score | Point-in-time | The FMCSA safety-rating signal — a leading indicator of future frequency and severity. |
F · The vehicle schedule — one row per unit
This is where the fleet’s real severity mix lives. InsightXtract reads the Excel vehicle schedule as a table — one row per unit — so an underwriter sees the heavy tractors, not just a headline count. Source: vehicle schedule (Excel).
| Column | Captured | Why it matters |
|---|---|---|
| Unit number | Per-row | The identifier that ties each unit to coverage, values, and any claim. |
| Year · make | Per-row | Age and manufacturer — drives physical-damage value and reliability. |
| Body type | Per-row | Van, box truck, tractor, tanker — the class that sets the severity profile. |
| GVW (gross vehicle weight class) | Per-row | Weight class — heavy units cause the biggest verdicts and drive nuclear exposure. |
| Operating radius | Per-row | Per-unit road exposure — reveals long-haul units hidden inside a “local” fleet. |
| Cost new / stated value | Per-row | The physical-damage insured value — normalized to currency for the schedule total. |
G · The driver schedule — one row per driver
Driver quality is the number-one predictor of auto losses. InsightXtract reads the driver roster as a table — one row per driver — with the experience and violation detail that summary counts throw away. Source: fleet application (driver schedule).
| Column | Captured | Why it matters |
|---|---|---|
| Driver name | Per-row | The individual behind the wheel — the unit of driver-quality analysis. |
| License state | Per-row | Licensing jurisdiction — standardized against the state-code lookup for consistency. |
| Years of experience | Per-row | Tenure — inexperienced drivers are a direct frequency signal. |
| MVR violations | Per-row | Motor-vehicle-record violations — the clearest proxy for individual crash risk. |
| Date of hire | Per-row | Turnover and tenure with the account — normalized to an ISO date. |
H · The loss run — one row per claim
The single biggest pricing input. InsightXtract reads each claim as a row across the loss run, capturing cost, development, and venue so the rate reflects what actually happened. Source: loss run (Excel).
| Column | Captured | Why it matters |
|---|---|---|
| Claim number · date of loss | Historical | Each loss’s identity and timing — the basis for frequency and maturity. |
| Claimant · line of coverage | Historical | Who was hurt and under which coverage — separates auto liability from physical damage. |
| Cause of loss · state | Historical | The nature and venue of the loss — state is standardized against the state-code lookup. |
| Incurred · paid · outstanding reserve | Historical | Cost, development, and open exposure still on the books — all normalized to currency. |
| Status (open / closed) | Historical | Open claims can still develop upward — the difference between a settled and a live exposure. |
From dozens of fields to one connected record
Pulling these parameters out of five documents is only half the job. The value is in consolidation: the insured named on the application, the broker on the email, the units on the vehicle schedule, the drivers on the roster, and the claims on the loss run all describe one account. InsightXtract merges them into a single record by a declared source-of-truth priority — the application wins on insured and coverage details, the email fills the broker and ask — then runs the post-processing that makes the data trustworthy: state codes, NAICS, and license states are standardized against reference lookups; currency and date fields are normalized; and required fields are validated before the record ever reaches an underwriter.
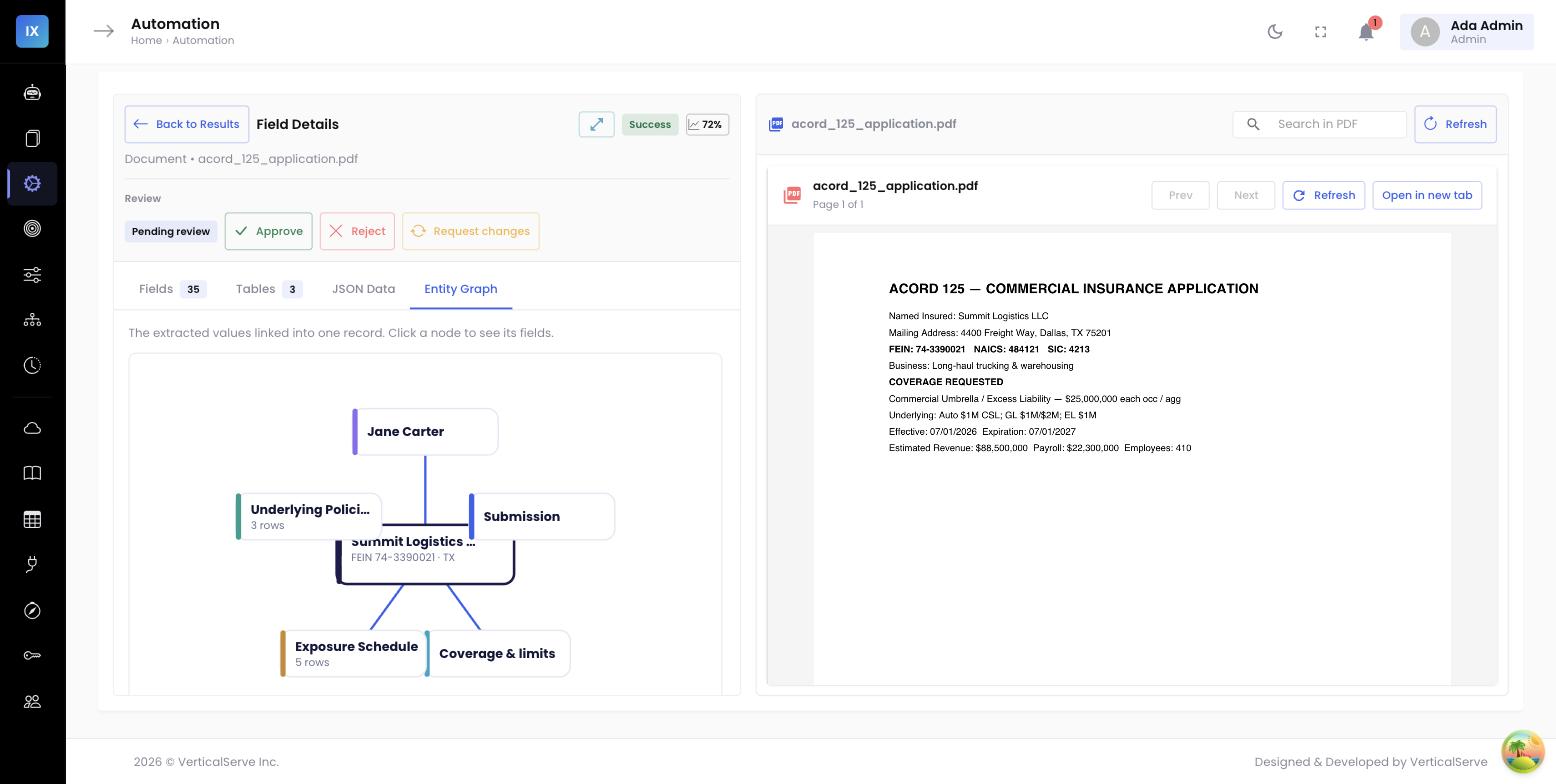
Why the graph, not just a form
An underwriter doesn’t think in flat fields — they think in relationships: do the heavy units on the vehicle schedule line up with the hazmat flag and the long-radius operations? Do the drivers with the most MVR violations sit on the units with the largest losses? The entity graph makes those connections explicit and clickable, with every value cited back to the row it came from.
Why it matters to the business
Comprehensive, structured, per-unit extraction isn’t a data-entry nicety — it changes the economics and quality of a commercial auto book:
- Heavy trucks and nuclear verdicts. Severity in auto is concentrated in the heaviest units. Capturing GVW and body type per vehicle — not as a summary count — means the exposure that drives eight-figure verdicts is visible and priced, not averaged away.
- Driver quality, made explicit. Reading the driver schedule row by row surfaces experience and MVR violations at the individual level — the number-one predictor of frequency — instead of a single “42 drivers” that hides the risky ten.
- Radius and mileage exposure. A local fleet and a long-haul fleet of the same size are different animals. Extracting radius and annual mileage — at both the fleet and unit level — lets you rate the road exposure that actually generates claims.
- CSA and regulatory signal. Pulling DOT, MC, and CSA data by default puts the federal safety record in front of the underwriter at intake, where it can shape appetite — not after a loss.
- Faster quotes, coded consistently. An underwriter opening a consolidated, cited, reference-coded record instead of an email plus three spreadsheets triages and prices in minutes — and every account is coded the same way, with provenance to the source document.
The Commercial Auto / Fleet agent extracts all of this today — the insured and identity block; broker and submission; coverage and limits including combined single limit, hired & non-owned, and cargo; the fleet summary with DOT/MC/CSA regulatory data; and three linked tables — the per-vehicle schedule, the per-driver schedule, and the loss run — consolidated into one coded record, every value cited to its source and standardized against reference lookups. And because it’s all configuration — fields and tables in the agent’s output contract, not code — the schema keeps pace with what underwriters ask for.
Related reading →
See how the same pipeline handles adjacent casualty lines: inside an excess casualty submission, and inside a workers’ compensation submission.