
Ask an underwriter what a renewal really involves and the honest answer is a scavenger hunt. Find last year’s file. Chase the broker for the updated statement of values. Wait for the fresh loss runs. Open both years’ workbooks side by side and squint at the numbers to figure out what changed. Only after all of that — often days later — does the actual underwriting begin. The judgment work, the part only a person can do, is gated behind hours of manual assembly and comparison.
The insight InsightXtract is built around is simple: at renewal, you already have last year’s account. You know the SOV, the loss history, the exposures. So the valuable question is not “what does this account look like?” — it is “what changed since last year?” If the platform can pull this year’s documents, extract them into the same structure as last year’s, and compute the difference, the underwriter can open the renewal already looking at the deltas that matter.
The renewal builds itself
The whole flow runs without anyone assembling a pack by hand. Documents are pulled through connectors, extracted into a consistent structure, compared against the prior term, and the differences are surfaced in the underwriter’s workstation as a delta view.
flowchart LR
    subgraph Sources
      SP["Broker SharePoint
(updated SOV / exposure)"]
      EM["Broker & partner email
(loss runs, attachments)"]
    end
    SP --> PULL["Connector pull
(scheduled / on renewal trigger)"]
    EM --> PULL
    PULL --> X["Extract
SOV, loss runs, exposure
into common schema"]
    X --> PRIOR["Load prior-term
extracted record"]
    PRIOR --> DIFF["Year-over-year diff
(added / removed / changed)"]
    X --> DIFF
    DIFF --> WS["UW workstation
delta view"]
    WS --> UW(["Underwriter reviews
only what changed"])
Two things make this work. First, the connectors reach into where the documents actually live — a broker’s SharePoint folder, a shared mailbox, a partner portal — and pull the renewal documents automatically, on a schedule or when the renewal date approaches. Second, the extraction produces the same structured record every year, so this year and last year are directly comparable. Without a stable schema, a year-over-year diff is meaningless; with one, it is arithmetic.
Pulling the documents: connectors, not inboxes
Renewal documents do not arrive in a tidy queue. The updated SOV might be dropped in a broker’s SharePoint site; the loss runs come as email attachments from the carrier of record; the exposure schedule is a workbook a partner posts to a shared drive. InsightXtract’s connectors monitor those locations and pull new documents as they land, tying each one to the right account and renewal. No one forwards an email or downloads-and-re-uploads a file.
Because the pull is automatic and scheduled, the renewal file starts assembling itself well before the underwriter picks it up. By the time the account surfaces in their queue, this year’s SOV, loss runs, and exposure data are already in, already extracted, already compared to last year.
Extraction into a consistent structure
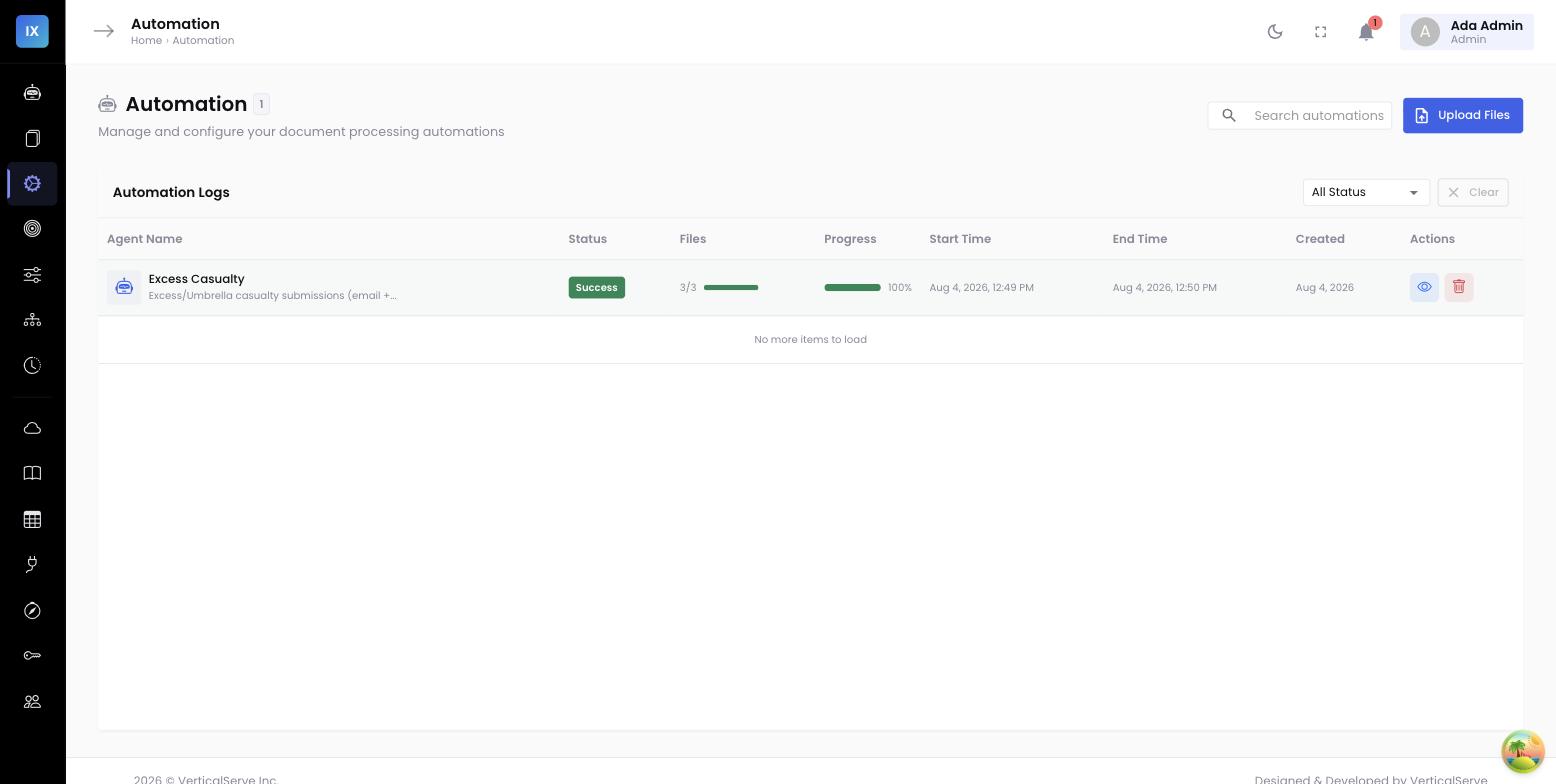
Each document type is extracted into the shape the platform already knows. The SOV becomes a structured table of locations with their construction, occupancy, and total insured value. The loss runs become a normalized claims history with dates, causes, paid and reserved amounts. The exposure schedule becomes a set of rated exposures — payroll, sales, square footage, vehicle counts — depending on the line. Values are standardized through glossaries and lookup tables so that “Frame” and “Wood Frame,” or “NC” and “North Carolina,” land in the same normalized bucket every year.
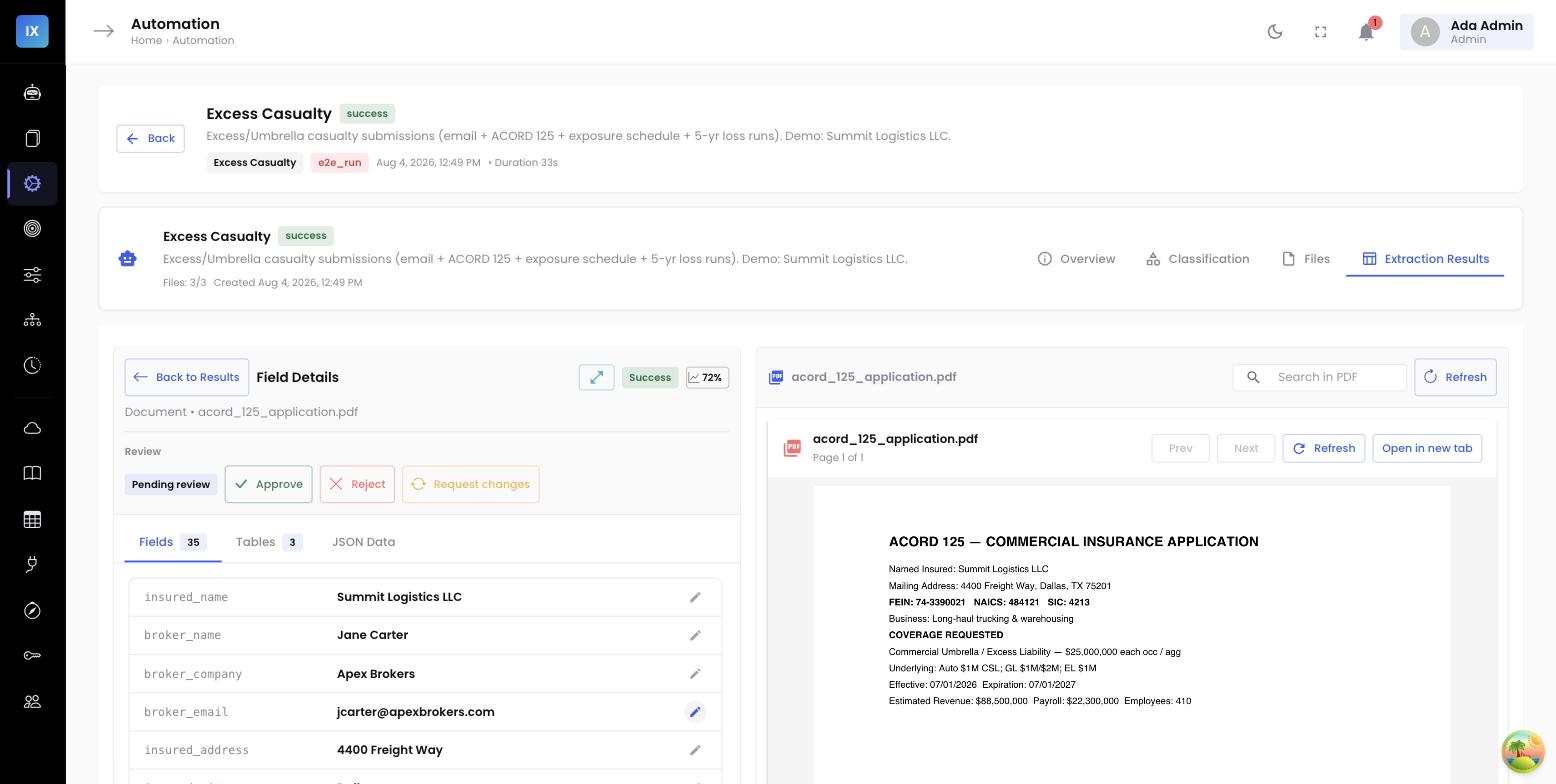
That consistency is the quiet hero of the whole feature. A diff is only as trustworthy as the alignment underneath it. Because a location is matched year to year by a stable key rather than a fuzzy address string, and because values are normalized before comparison, the platform can tell the difference between a location that genuinely changed and one that was simply written differently on this year’s spreadsheet.
The year-over-year diff
With both years in the same structure, the diff is direct. InsightXtract compares this year’s extracted record against last year’s and classifies every change: locations added or removed, values that increased or decreased, and new entries in the loss history. Each change is quantified — not just “TIV changed” but “TIV up 14%, driven by a new location and a revaluation of two existing ones.”
Worked example: a mid-market property renewal
The renewal for a regional retailer comes up. InsightXtract pulls this year’s SOV from the broker’s SharePoint and the fresh loss runs from email. The delta view shows the underwriter three things at a glance: total insured value is up 14% versus the expiring term; one new location has been added (a distribution center in a different county); and the loss runs carry a new water-damage claim that was not in last year’s history, flagged for review. The exposure schedule shows payroll up in line with the new location — an exposure-change flag the underwriter would want to price for. None of this required opening two workbooks side by side.
The changes are ranked by materiality, so the underwriter sees the 14% TIV jump and the new claim first, not a wall of unchanged rows. Exposure-change flags — a payroll swing, a new vehicle class, a jump in square footage — are called out explicitly because they are the signals most likely to move the price.
What the underwriter actually sees
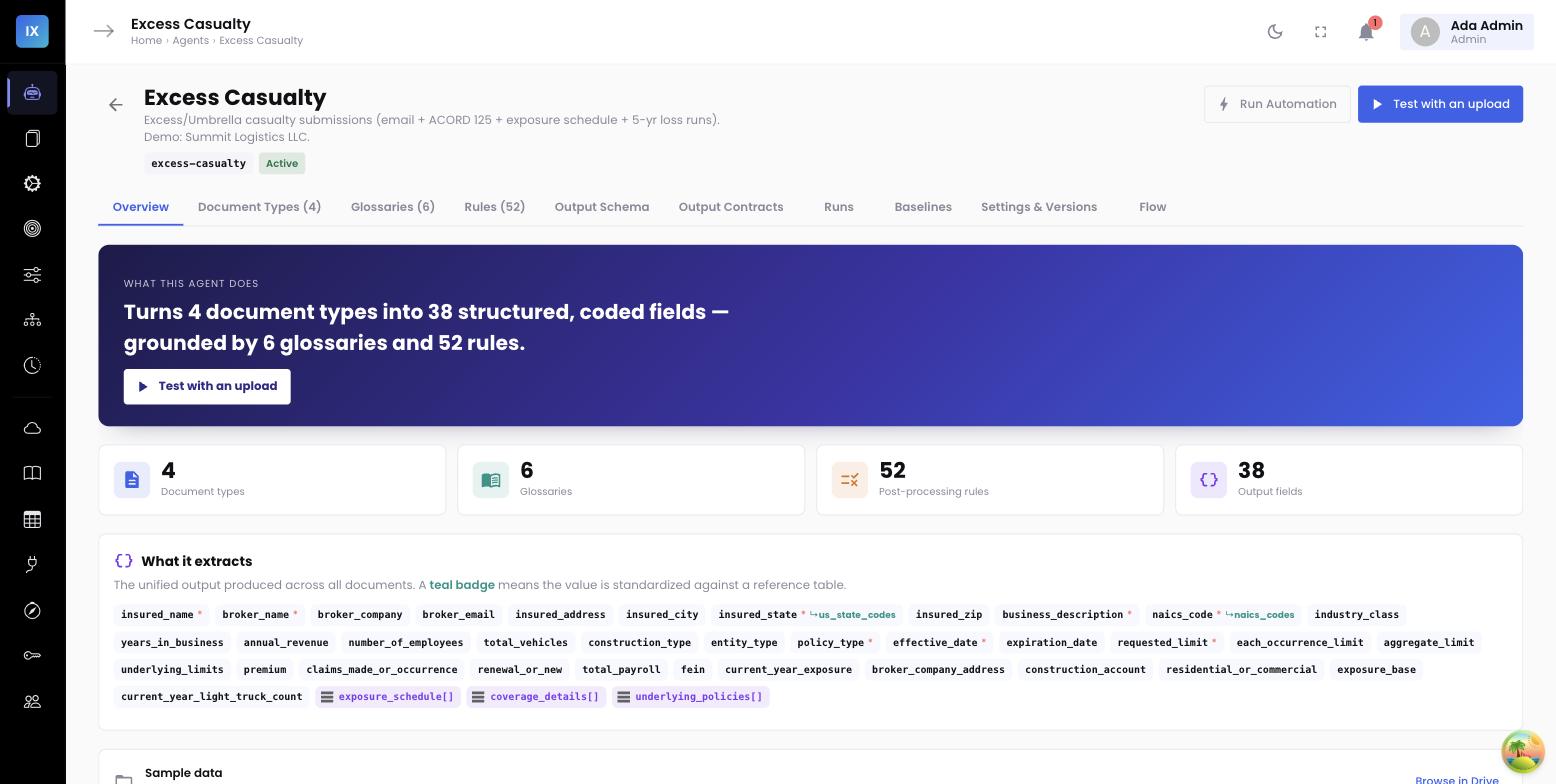
The point of all of this is what lands in the workstation. Instead of a folder of PDFs and a blank comparison to build, the underwriter opens a renewal that says, in effect: here is what changed, here is by how much, and here is what to look at first. The unchanged 90% of the account fades into the background; the material 10% is front and center, each item traceable back to the exact cell in the source document it came from.
That does not replace underwriting judgment — it clears the runway for it. The underwriter still decides how to price the new location, whether the water-damage claim signals a trend, and how the exposure growth affects terms. They just get to spend their time on those decisions instead of on assembling the evidence to make them.
Why this matters to underwriting and ops
- Renewals start from what changed. The delta view replaces hours of side-by-side comparison with a ranked list of material differences.
- Documents arrive on their own. Connectors pull the SOV, loss runs, and exposure data from broker and partner locations, so the file is assembled before the underwriter touches it.
- Comparisons are trustworthy. A stable schema and normalized values mean a flagged change is a real change, not a formatting difference.
- Capacity without headcount. When the assembly and comparison work is automated, each underwriter can carry more renewals at the same quality.
Related: normalizing at volume →
The same normalize-to-a-known-schema engine powers delegated-authority data too. See bordereaux at scale — per-MGA agents, called by API, normalized to your treaty schema.