
Consider a mid-market account: a parent company and two subsidiaries on the policy, operating out of nine locations, requesting general liability, auto, and umbrella, with fourteen claims over five years. Now try to represent that as a flat record. insured_name — which of the three? location_state — which of the nine? claim_amount — which of the fourteen? A single row of fields can’t hold a submission, because a submission has cardinality: many insureds, many locations, many coverages, many claims. The moment you force it flat, you either lose data or bolt on brittle location_1_state, location_2_state columns that no downstream system wants.
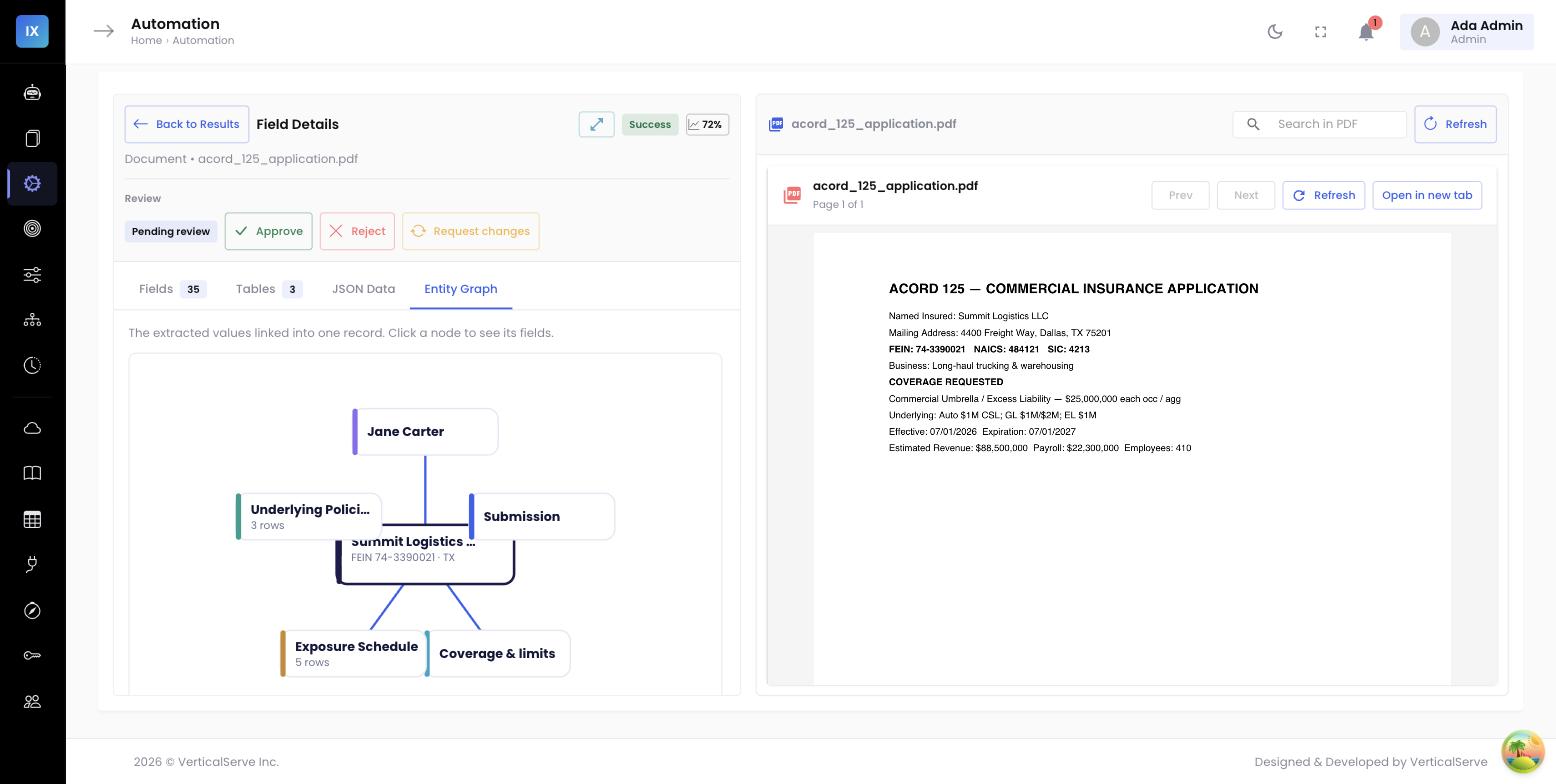
InsightXtract represents an extracted submission the way the business does — as a graph of entities with types and relationships. The insured is at the centre; parties, places, and transactions hang off it, each a first-class object with its own fields.
Three kinds of entity
| Kind | Examples | Cardinality |
|---|---|---|
| Party | Named insured(s), broker, producer, additional insureds | Often many — parent + subsidiaries, JVs |
| Object | Locations, vehicles, buildings, scheduled property | Many — one row each |
| Transaction | Coverages, claims, policies, loss records | Many — the loss run, the coverage tower |
Because these are typed entities with real cardinality, a submission with three named insureds is modeled as three party entities — one flagged primary — not squeezed into a single insured_name string. Values are addressed by entity-scoped paths like insured.fein, locations[].tiv, or claims[].incurred, so the structure is explicit and queryable.
{
"named_insureds": [
{ "name": "Acme Logistics, LLC", "fein": "47-2831905", "is_primary": true },
{ "name": "Acme Freight Co.", "is_primary": false }
],
"locations": [ { "state": "TX", "tiv": 4200000 }, /* … 8 more */ ],
"coverages": [ { "line": "umbrella", "each_occurrence": 10000000 } ],
"claims": [ { "date_of_loss": "2024-03-11", "incurred": 88500 }, /* … 13 more */ ]
}
The insured at the centre, everything connected
Modeling entities as a graph — rather than a bag — means the relationships are part of the data: this claim belongs to this coverage; this location is operated by this named insured. That’s exactly how an underwriter reasons about an account, and exactly what a rating engine or policy system needs to consume it.
Acme Logistics, LLC")) --- I2["Acme Freight Co.
(subsidiary)"] I --- B["Broker"] I --- L["Locations · 9"] I --- C["Coverages · GL · Auto · Umbrella"] I --- CL["Claims · 14 (5 yr)"] I --- E["Exposures · payroll · fleet"]
Why the model shape matters
- It maps into your systems. A PAS, a data warehouse, and a rating engine all model insurance as related entities — parties, risks, coverages, claims. Extracting into that shape means no impedance-mismatch layer to build.
- It handles the real world. Multiple named insureds, many locations, a full loss run — the cases that break flat records are the normal case here, not an exception.
- Relationships carry meaning. Tying each claim to its coverage and each location to its operator preserves the connections underwriters and analytics depend on.
- It’s explorable. A connected model can be walked and clicked — from insured to coverage to the claims eroding it — instead of scanned as a wall of fields.
Cardinality is the tell
The quickest way to spot a tool that treats documents as field bags: ask what it does with a second named insured, or a tenth location. If the answer is a numbered column or “we take the first one,” the model is flat. A submission is inherently many-to-many — the data model has to be too.
Read next →
See how each entity gets a stable identity across documents and systems: master data at extraction time. And the record it all conforms to: output contracts.